Debugging Stratego in Spoofax Projects
Spoofax supports debugging of Stratego code used in the implementation of the various editor services. The Stratego debugger re-uses the Eclipse Debug Perspective making debugging Stratego code similair to debugging Java code. Debugging can be enabled/disabled per project as it has a negative impact on the performance. The debugger has to be enabled for two components: (1) enable debug instrumentation in the ant build file and (2) enable the debug mode for the runtime. Currently, debugging support is only available in the nightly builds of Spoofax, use http://spoofax.org/update/nightly as the Eclipse Update site.Enable Debug Instrumentation
First, to enable debug instrumentation add a file called .debugmode in the project directory. Adding this file will make sure the project is build with debug information. Second, change the provider in the Builders.esv file from ctree to jar. And third, change the "all" ant target from<target name="all" depends="spoofaximp.default"/>to
<target name="all" depends="spoofaximp.default.jar"/>Now rebuild the project. After a succesful build the trans-debug directory contains the stratego files from the trans directory instrumented with debug information. The instrumented stratego files are compiled to a jar file that is located in the include directory.
Enable Debug Runtime
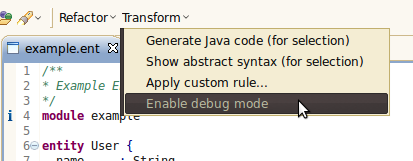
Although the project is build with debug information the debug mode still has to be enabled. It is wise to only enable debug mode when it is really needed as it has a huge impact on the performance. Disabling debug mode will still instrument the stratego code, but any breakpoints are ignored. Select a DSL file (probably in the test directory of the project). Select Enable debug mode from the Transform menu to enable stratego debugging for this Spoofax project. Sometimes the project will rebuild.
Check if the debug mode was actually enabled by clicking on the Transform menu, the Enable debug mode menu item should have changed to Disable debug mode.
If not select the Enable debug mode menu item again.
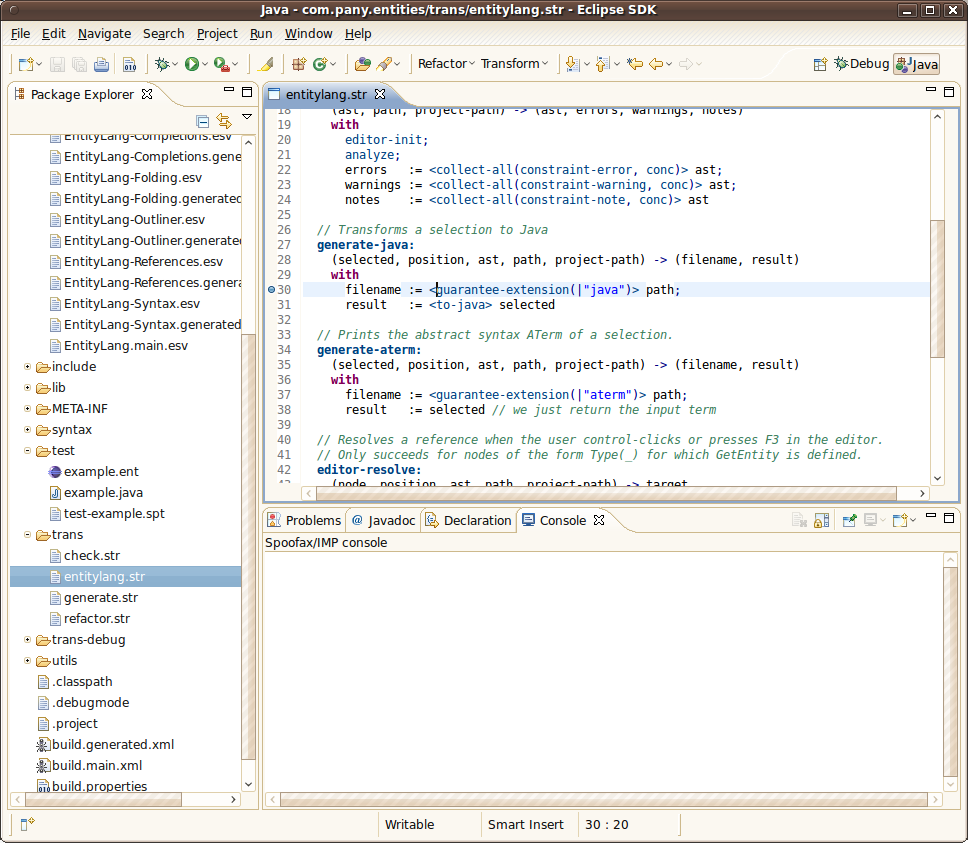
Now open a stratego file and set a breakpoint.
Sometimes the project will rebuild.
Check if the debug mode was actually enabled by clicking on the Transform menu, the Enable debug mode menu item should have changed to Disable debug mode.
If not select the Enable debug mode menu item again.
Now open a stratego file and set a breakpoint.
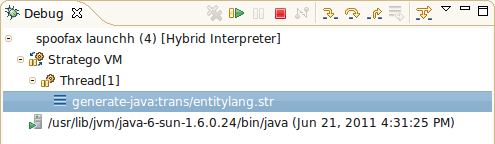
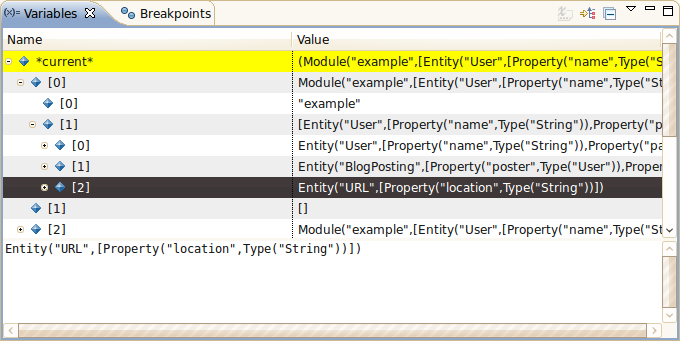
 When this breakpoint is hit Eclipse switches to the Debug View and the execution is suspended.
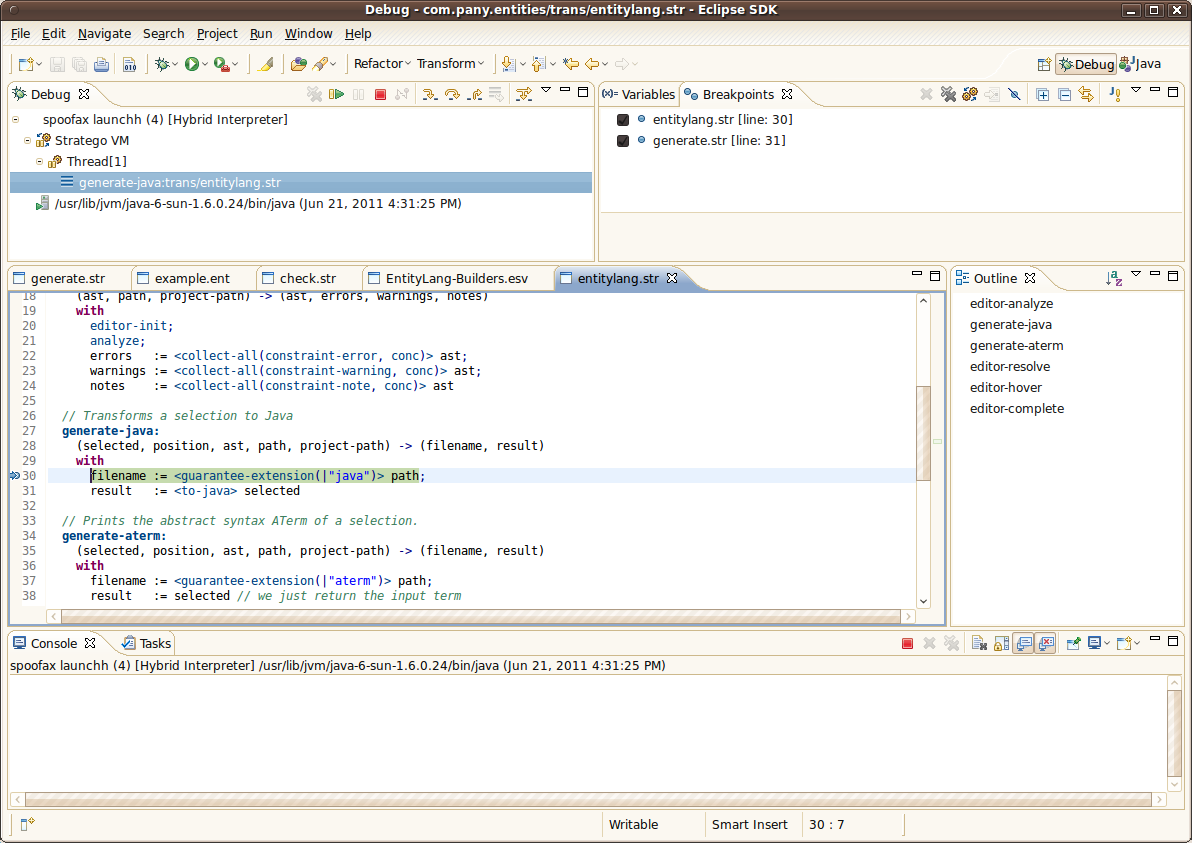 The variables window shows the available variables, the current term (*current*) and the names of the dynamic rules that are available (*dynamic rules*).
 Also, you can control the execution of the program with Step Into (F5), Step Over (F6), Step Return (F7) and Resume (F8).
 -- RickyLindeman - 22 Jun 2011
 Attachment  | Action  | Size | Date | Who | Comment |
|---|---|---|---|---|---|
| | manage | 180.9 K | 22 Jun 2011 - 09:56 | RickyLindeman | |
| | manage | 144.9 K | 22 Jun 2011 - 09:59 | RickyLindeman | |
| | manage | 20.8 K | 22 Jun 2011 - 09:59 | RickyLindeman | |
| | manage | 15.6 K | 22 Jun 2011 - 09:59 | RickyLindeman | |
| | manage | 45.4 K | 22 Jun 2011 - 10:00 | RickyLindeman |
Revision: r1.3 - 01 Feb 2013 - 09:14 - GuidoWachsmuth